
The Real Cost of Manual Client Reporting — In Hours, Pounds, and Client Trust
Client reporting is the most expensive administrative task in most agencies — and the one that is most resistant to being recognised as a problem because it looks like core work. It is not. Logging into six platforms, extracting numbers, pasting them into a template, formatting the slides, writing the commentary, and sending the report is not strategic work. It is data transfer. And in 2026, software does data transfer better, faster, and more accurately than humans do.
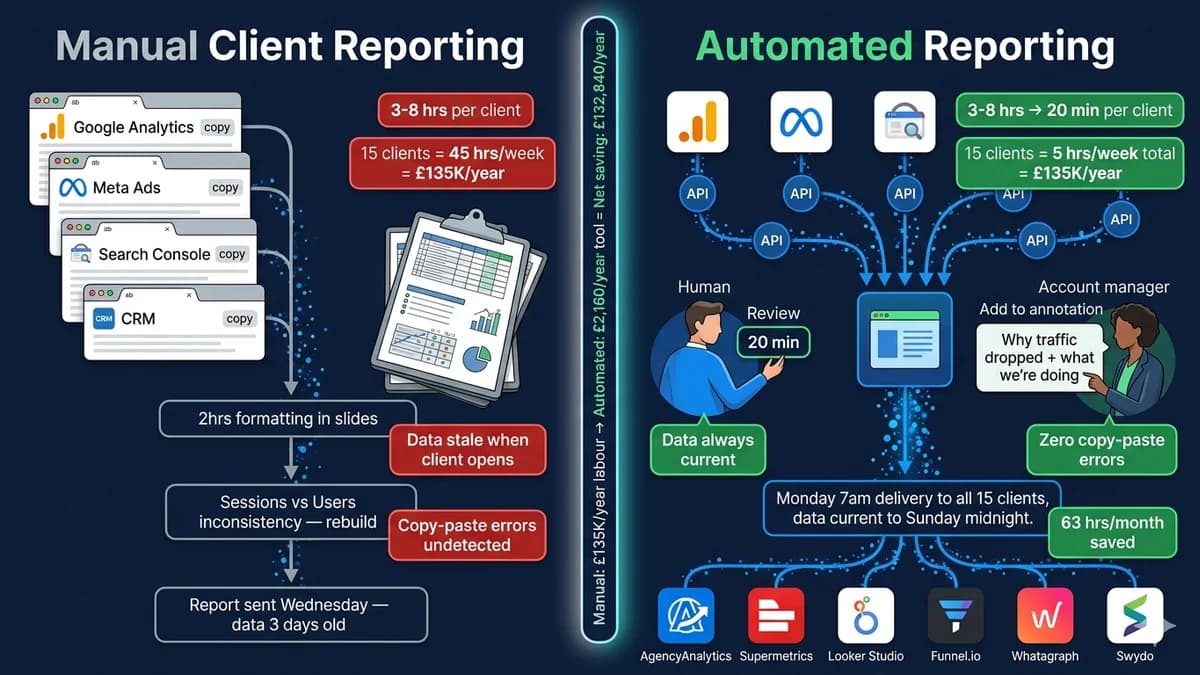
Take the numbers at face value. Fifteen clients, three hours per report per client per month. That is 45 hours per month — roughly one full working week — spent by your most expensive people on copy-paste. At a blended agency rate of £60 per hour, that is £2,700 per month or £32,400 per year spent on formatting. For a 30-client agency, DashThis data puts this figure at approximately £5,250 per month. For a 50-client agency, the labour cost of manual reporting runs close to £144,000 annually. And none of those hours produce a single insight. They produce a container for insights that could have been produced automatically.
The accuracy objection — the reason most agencies hesitate to automate — is the claim that removing humans from the reporting loop will introduce errors that nobody catches. This guide makes the case that this objection is backwards. Manual reporting has five specific accuracy failure modes that automated reporting eliminates entirely. The setup sequence that guarantees accuracy in automated reporting is four steps. And the things humans must still contribute — insight, commentary, anomaly investigation — are exactly the things that were being crowded out by the copy-paste work automation removes.
The Accuracy Myth — Why “Manual Is More Accurate” Is Wrong
The accuracy objection to client reporting automation runs like this: “If a human is in the loop, they can catch errors. If the automation pulls wrong data, nobody notices until the client does.” This sounds reasonable. It is not accurate, for two reasons.
First: the human in the loop is not systematically checking accuracy. They are copying numbers from a platform screen into a template and trusting they copied correctly. There is no validation step. There is no cross-reference check. If a team member copies the Sessions figure instead of Users, or pulls the date range from last quarter instead of this quarter, or applies the wrong attribution window to a conversion metric — the error goes into the report, gets formatted beautifully, and arrives in the client’s inbox looking authoritative. The manual process provides the appearance of quality control, not the reality of it.
Second: automated reporting tools pull data directly from platform APIs — the same API that the platform’s own dashboard uses to display the numbers. The data in the automated report and the data in the platform are identical by construction. There is no copy step where an error can be introduced. The accuracy question for automated reporting is not “will the tool pull the wrong number?” but “is the tool connected to the right data source and configured with the right metric definitions?” — which are one-time setup questions, not per-report execution questions.
5 Accuracy Failure Modes in Manual Reporting — and How Automation Eliminates Each
Manual reporting requires a human to read a number from one interface and type or paste it into another. Transposition errors, wrong cell selection, and incorrect date range application are the most common manual reporting accuracy failures — and they are invisible unless someone compares the report figure to the source platform figure for every metric on every report.
Different team members may calculate the same reported metric differently. One person reports "website visitors" as Sessions. Another reports it as Users. Both numbers come from Google Analytics, both are defensible definitions, and they are typically 15–25% different. When clients compare last month's report to this month's, they see a change that is definitional, not performance-driven — and they ask why traffic dropped.
A monthly report that takes 3–8 hours to compile is delivered 3–8 hours after the reporting period closes — at best. In practice, most manual reporting has a lag of 1–4 days while someone finds time to compile it. The data the client receives on Wednesday for the period that ended Sunday is already 3 days out of date. For fast-moving channels like paid advertising, a 3-day reporting lag is operationally significant.
Different marketing platforms report the same conversions differently — Meta Ads uses a default 7-day click, 1-day view attribution; Google Ads uses last-click with data-driven blending; GA4 uses a different model again. Manual reports often apply whatever attribution each platform shows by default, which means the numbers across channels cannot be meaningfully compared. Clients see total conversions that exceed actual sales and ask why.
Many manual reports include screenshots from platform dashboards. Screenshots cannot be verified — the client cannot click through to the source data, cannot change the date range to confirm, and cannot audit the figure against their own platform access. Screenshots also miss context: a cost-per-click screenshot does not show the impression count that would reveal whether the sample size is statistically meaningful.
The 4-Step Setup Sequence That Guarantees Accuracy
The most common reason automated reporting produces inaccurate results is not a tool failure — it is a setup failure. Specifically: automating before standardising. The four-step sequence below addresses this by putting data standardisation before automation, making accurate automated reporting structurally inevitable rather than hoped-for.
Define Metric Standards Before Connecting Anything
Before connecting a single platform to your reporting tool, document the exact metric definition for every KPI in your standard reports: which metric, which attribution window, which date comparison, which segment filter. Write this as an agency standard document. Every client report uses these definitions unless there is a client-specific exception (which must also be documented). This is the step that eliminates Failure Mode 2 — metric definition inconsistency.
Connect Data Sources and Run in Parallel for 2–4 Weeks
Connect your reporting tool to each platform via API. Then — critically — run automated and manual reports in parallel for 2–4 weeks. Compare every figure in the automated report to the platform source for the same date range and metric. Discrepancies at this stage are almost always configuration errors (wrong attribution window, wrong segment, wrong date alignment) that are fixed once and never recur. This parallel run is not optional — it is the quality assurance process that certifies your automation before it goes live to clients.
Build Master Templates and Replicate Per Client
Create one master report template with the full metric structure. Per-client customisation is handled by swapping the data source, not rebuilding the template. Brand it with the client's colours and logo using white-label options in your reporting tool. This template approach means a change to the report structure — a new metric added, a section redesigned — is made once and propagates to all linked client reports automatically. Peak Seven documented 63 hours per month saved in part through exactly this master template approach in Whatagraph.
Configure Automated Delivery and Anomaly Alerts
Set the delivery schedule (weekly, monthly), delivery method (email, Slack, client portal link), and the anomaly detection thresholds that flag unusual data movements for human review. An automated report that delivers a 90% traffic drop without flagging it for investigation is worse than a manual report — because nobody noticed. Anomaly alerts should trigger a human review process, not silence. Configure thresholds for significant metric movements (20%+ week-on-week change) and assign a named reviewer for each account.
Want an expert to map your current reporting workflow, identify the exact tools that fit your client mix, and configure the automation so the first live report is accurate?
Free 45-minute reporting automation audit. We map your current process, calculate the monthly hours and cost, recommend the right tool stack for your agency size, and outline the setup sequence.
The 2026 Client Reporting Automation Tool Stack — With Pricing
| Tool | 2026 Pricing | Best For | Connectors |
|---|---|---|---|
| AgencyAnalytics | $12/client/month15 clients = $180/month | Agencies with 5–50+ clients wanting purpose-built reporting. White-label, client portal, AI-generated insights. Fastest path from manual to fully automated with minimal setup friction. | 80+ including Google Analytics, Meta, Search Console, LinkedIn Ads, Shopify, HubSpot |
| Swydo | $69/month baseunlimited clients, 10 data sources | Mid-size agencies needing professional reporting without enterprise cost. Scales by data source count rather than client count — economical for high-client, low-channel-diversity agencies. | 40+ marketing platforms. Additional sources at marginal cost. |
| Whatagraph | Custom pricingContact for quote | Agencies prioritising visual impact and AI-powered narrative. Whatagraph IQ generates text summaries and insight callouts. Master template replication. Best for premium client relationships where report presentation matters. | 45+ platforms. Strong marketing platform coverage. |
| Supermetrics | $47–$222/monthStarter to Growth | Agencies who want to keep using their existing BI tools (Google Sheets, Looker Studio, Power BI, Tableau) but eliminate manual data collection. Best for data-literate teams who want full control over report design and calculation logic. | 150+ platforms. Widest connector library available. |
| Funnel.io | Premium tierContact for quote | Sophisticated agencies serving clients who need forward-looking analysis, pacing monitoring, and attribution normalisation across channels. Funnel standardises data definitions and budget pacing — not just reporting delivery. | 500+ connectors. Strongest for complex multi-channel attribution. |
| Looker Studio (Google) | FreeRequires Supermetrics for multi-platform | Starting point for agencies with smaller client counts who want to stop manual reporting immediately. Connect Google Analytics, Search Console, and Google Ads natively. Add Supermetrics for other platforms. | Native Google connectors free. Supermetrics adds 150+ others. |
| DashThis | $49–$399/monthBy dashboard count | Teams needing real-time dashboards quickly with minimal setup. Good for single-platform or low-complexity reporting. Pricing by dashboard count makes it more expensive at scale than per-client tools. | 34+ native connectors. |
The recommended starting path for most agencies (5–20 clients, mixed channel clients): AgencyAnalytics handles 80% of agency reporting requirements with the lowest setup overhead — connect your client’s Google, Meta, and Search Console accounts, apply the master template, configure delivery, and you are live. For clients with complex data needs (e-commerce attribution, custom CRM data, multi-channel pacing), add Supermetrics to push to Looker Studio or Power BI for the specific accounts that require it. Total stack cost for 15 clients: under $300/month against a £32,000+ annual manual labour cost.
The Reporting Automation ROI Formula — Run It for Your Agency
What Must Stay Human — The Difference Between Data and Insight
Automated reporting delivers accurate, timely, consistently formatted data. That is the complete scope of what automation should do. The parts of client reporting that create actual business value for your clients — and that differentiate your agency from one that just sends dashboards — are the parts that automation cannot do and should not attempt.
⚡ What Automation Handles Completely
- Data collection from all connected platforms
- Metric calculation with consistent definitions
- Formatting and white-label branding
- Scheduled delivery to client portals or email
- Period-over-period comparisons
- Anomaly flagging for unusual metric movements
- AI-generated headline performance summaries (Whatagraph IQ, AgencyAnalytics)
- Dashboard updates and real-time data refresh
💡 What Humans Must Still Do
- Interpret the data story: what does the pattern mean for this client's business?
- Write client-specific commentary: why did this happen and what does it indicate?
- Make strategic recommendations: where should next month's budget go based on this data?
- Investigate flagged anomalies: when something unusual appears, find the cause
- Validate the first report for new clients against source platform data
- Adjust template and metric selection as client goals evolve
- Have the strategic conversation that turns the report into a roadmap
When automation removes the data-assembly step, account managers shift from being data janitors to being data interpreters. The same person who spent 3 hours compiling a report now spends 20 minutes reviewing it and 40 minutes crafting the strategic narrative that makes the data meaningful to the client. This shift — from reporting to advising — is what improves client retention. Clients do not leave agencies because the reports are slow or formatted imperfectly. They leave because the agency is not helping them make better decisions. Automated reporting is what creates the time to have that conversation.
When Off-the-Shelf Reporting Tools Are Not Enough — Custom Automation
Standard reporting tools handle 80–90% of agency reporting requirements well. The remaining 10–20% — where off-the-shelf tools cannot deliver what the client relationship requires — is where custom automation becomes the answer.
Proprietary Data Sources Without Standard API Connectors
If a client's key business metric lives in a custom CRM, an industry-specific platform, or an internal database that standard reporting tools don't support, no off-the-shelf tool will pull it. Custom data pipelines extract the proprietary data, standardise it, and push it into the reporting layer — enabling the client's actual performance metrics to appear alongside the standard channel data.
AI-Generated Report Commentary and Narrative at Scale
For agencies managing 50+ clients where the human commentary layer becomes its own bottleneck, custom AI trained on your agency's reporting style and each client's industry context can generate first-draft commentary automatically. The account manager edits and approves — 5 minutes instead of 30. At 50-client scale, this represents a further 20+ hours per month recaptured from a task that standard reporting tools leave entirely to humans.
Multi-System Orchestration — Reporting as Part of a Wider Automation Stack
Agencies that have automated client onboarding often want reporting to connect into the same workflow: report delivered → insights flagged → account manager task created → client meeting booked. This orchestration layer — connecting reporting to CRM, project management, and communication tools in a triggered workflow — exceeds what standard reporting tools handle natively.
Investor-Grade or Compliance-Sensitive Reporting
Clients in regulated industries or those who use agency performance data for investor reporting require audit trails, data provenance documentation, and verification layers that consumer-grade reporting tools do not provide. Custom reporting automation built on enterprise data infrastructure — with role-based access, data lineage tracking, and approval workflows — serves this requirement where standard tools cannot.
Client reporting automation is one of the clearest business process automation examples available — because the before-and-after is immediately measurable in hours, the ROI calculation is transparent, and the implementation does not require months of process redesign. For broader context on how reporting automation fits within a wider agency automation programme, see our agency workflow automation guide and our business process automation framework.
Ready to stop spending 3–8 hours per client per month on data assembly and start spending that time on the strategic analysis that retains clients?
Free 45-minute audit. We map your reporting workflow, calculate your monthly recovery, and recommend the exact tool stack for your client mix.


